


Driven Brands [DRVN]

This post was originally written on 1/5/2025 with numbers current as of that date.

Investment Overview:
Driven brands (DRVN) is now at an inflection point over the next 18-36 months where the US car wash business has stabilized, management investment priorities have refocused on organic growth/integration, debt paydown and the crown jewel Take 5 segment is set to become 70%+ of total company EBITDA YE 2026.
Trading at 8x NTM EBITDA, DRVN has the potential in a bull case to be assigned the compounder label and subsequent multiple (see YAVB interesting blog on this topic) over the next 18-36 months through steady organic growth and a simplification of its financial statements opening the Street’s eyes to Take 5’s underlying quality. DRVN is a $2.3B revenue, $550M EBITDA/$230M UFCF automotive services platform with a $2.6B market cap. Roark-backed, DRVN went public in January 2021 and treaded water, burning off its multiple until May 2023 when they announced the abrupt and unforeseen exit of then-CFO Tiffany Mason. Three months later they cut the EBITDA guide by 9% due to increasing competition in the car wash space causing the stock to fall 40% and de-rated to 12.5x EBITDA. One year later, shares fell another 20% after the 2nd CFO resignation in 12 months and the car wash and glass businesses continued to struggle.
DRVN EV/TTM EBITDA Premium (Discount) to SPX
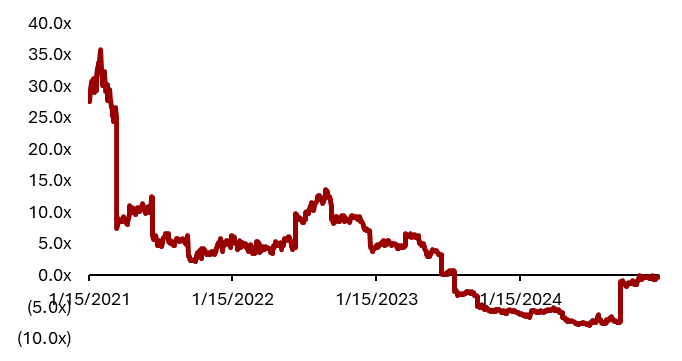
We believe this opportunity exists due to 1) poor historic capital allocation, 2) PE-spaghetti rapid roll-up (and overhang – Roark still owns 60%+ of the company) with poor integration and 3) poor segment reporting creating a complex narrative and making tracking the crown jewel (Take 5 Oil Change) difficult. As a result, the Street has chosen to focus on the business they know best, car wash (15% of EBITDA and shrinking), largely thrown their hands up at the complex modeling, and deemed this management team as untrustworthy/bad.
Our bet hinges on management refocusing on internal integration spurring organic growth and margin inflection after years of rapid acquisitions and potentially selling some or all of the struggling car wash business — in our view DRVN is a classic Good Co/Bad Co setup with abating complexity.
Segment Overview:
Maintenance (62% of adj. EBITDA) is made up of two businesses Meineke and Take 5 Oil Change. Meineke performs total aftermarket car care through its network of 775+ stores, is 100% franchised and did ~$40m in 2023 EBITDA with 0-3% SSS growth. Take 5 Oil Change is the hidden gem of the DRVN platform and made up almost 90% of maintenance segment EBITDA (~$285m) in 2023. Take 5 performs DIFM quick oil change & related maintenance services through its network of 1,007 stores. Take 5 is 66% franchised and grew LTM SSS ~6% (17% 2 year stack).
Paint, Collision and Glass (17% of adj. EBITDA) is made up of numerous brands including Carstar, Maaco, AutoGlassNow! and Abra. AGN is the 2nd largest glass repair network in North America, is 50% franchised and 35% of segment EBITDA. The company entered the glass business in Canada in late 2019 acquiring Clairus Group for $213m and then entered the US two years later by acquiring AutoGlassNow! for $174m. Over the next year they acquired 10 other brands and ran into integration issues in August 2023. 6 months later in February 2024, the integration under the AutoGlassNow! brand was complete. This segment has the potential to be a EV neutral long term growth opportunity for DRVN both from a ticket/traffic perspective fueling a M-HSD SSS algo and LDD % unit growth. Collision (CarStar, Abra and Fix Auto) operates 1,000+ stores, is 99% franchised and contributed 40% of segment EBITDA in 2023. SSS are low to mid single digit. Maaco operates 392 paint centers focused on non-insurance customers, is 100% franchised and 25% of Segment EBITDA. SSS are low single digit.
Platform (8% of adj. EBITDA) supplies auto parts to owned, franchised and other 3rd party locations through the brands Spire Supply, Driven Advantage and 1-800-Radiator. The Driven Advantage marketplace offers 95,000+ SKUs and counts 75% of eligible franchises as customers. Take 5 franchisees are required to buy all customer-facing products from Driven Advantage and Driven receives an 8-10% royalty on all franchisee spend on the platform. At the Investor Day, management shared that a franchisee with $1M AUV saves $50,000 annually using Driven Advantage because of the pooled purchasing power/scale. 1-800 Radiator is 40% of segment EBITDA with 203 locations that are 99% franchised and Spire distributes consumable products such as oil filters and wiper blades to Take 5 Oil locations and Meinekes. Driven has disclosed a somewhat murky “Procurement EBITDA” number in the past ($51/$37mm in 2023/2022), IR wasn't super helpful when we asked what segments contributed to this number but assume Driven Advantage and Spire are the main components. The segment also includes ATI (Automotive Training Institute) which provides operating training to independent maintenance shops.
Car Wash (13% adj. EBITDA) is made up of 2 divisions Take 5 Car Wash (“T5CW”) and IMO making it the largest car wash platform in the world with over 1,100 units. There are 388 company operated stores in the US doing $360m is system wide sales. This segment has struggled over the last 2 years, tainted the perception of the overall DRVN platform and gets more airtime than it deserves. The IMO platform is made up of 720 independently operated car washes (similar to a franchise model) in Europe and has been a stable, cash generative business with LSD SSS.
This will all tie to more than $6.5B in system wide sales, $2.3B in revenue in 2024, more than 5,100 stores and 70m+ cars served annually and >$550M of EBITDA.
Thesis 1: Simplified Story Focuses on Take 5 Quality
Continued SSS growth and company and franchised unit location growth at Take 5 will drive the maintenance segment to over 70%+ of company wide EBITDA by YE 2026 with a long runway for growth, compelling unit economics and strong structural and idiosyncratic drivers of a 4-7% SSS algo. Take 5 is a phenomenal business. Units cost $1.15m to build and generally take 3 years to reach maturity. Ramping units will comp at ~35% from year 1 to year 2 and 25% from year 2 to year 3 and then will grow 3-5% at maturity. Franchise units pay a 1% royalty in year 1, 5% in year 2 and 7% in year 3 and will have a 21% EBITDA margin at maturity (compared to ~34% EBITDA margin for company owned stores who don't have to pay the 7% royalty or the ~5-6% procurement margin on things like oil, wipers, filters). All in all this leads to incredibly attractive unit economics for franchisees with a 27% pre-tax ROIC, almost 25% IRR or a 2.5x MOIC. This is nearly all best in class as seen below.

We also believe that there are a few key drivers that suggest our 4% estimate of mature SSS growth is likely conservative.
1) There is an ongoing premiumization shift from conventional oil to premium synthetic blend and fully synthetic oil. Currently 90% of Take 5 customers get one of the premium tiers which is up from the mid 80s at the time they went public. We called nearly 3 dozen Take 5 stores to ask about their product mix and the pricing of each tier. We found that there is a 10%/40%/50% split between conventional, synthetic blend and fully synthetic which are a $55/$88/$105 ticket respectively with synthetic blend and fully synthetic coming at a 2.1x and 2.9x higher margin than the base tier. In the event that customers continue to shift to premium this could be a 110 bps tailwind to SSS over the next decade and an even larger $ impact on margins due to the previously mentioned margin uplift.
2) Non-oil change services (NOCS) such as coolant exchange or cabin air filter replacement revenue still have a long runway through increased attachment rate (low 40s today) and come at high incremental margins. Take Five can also roll out new service offerings (they have done this in the past moving from “Big 4 services” to “Big 6”. For comparison, VVV currently offers 12 additional services). To benchmark, we estimate the average ticket at Valvoline is ~$100 vs ~$85 at Take 5 primarily due to non-oil change attachment rate. We believe NOCS will add another 125-150bps to SSS.
3) Regular pricing: 100-150bps from automotive industry inflation which has outpaced CPI over time. Backed by our web scrape of historic pricing on comparison sites and company websites.
On the transaction side
4) DIY to DIFM shift and market share gains within DIFM. The car parc has grown at 1.2% CAGR over the last 50 years, the average age of the parc is at an all time high (less cars under warranty which need more frequent oil changes to continue operating smoothly) and vehicle miles traveled continues to grow has lead to a shift away from DIY to DIFM oil changes (15% of new VVV customers came from DIY in Q4’24). Additionally according to the Cox Automotive Service Industry Study (see slide 8), within the DIFM market quick lubes such as T5 and VVV are taking share of service visits from dealerships. VVV has also disclosed that 58% of new customers in Q4’24 came from dealerships and Tire/Auto Services. We believe the shift to DIFM and the share gains within the channel can be a 100 bps tailwind.
5) Commercial fleet growth is also an attractive tailwind to cars/day. Commercial fleet comes at 20% higher ticket than the average consumer ticket (higher NOCS attachment rate), is currently outpacing overall company growth and can add off-peak capacity utilization. In all we believe the B2B channel can add a 100-150bps tailwind to SSS. Take 5 also has an advantaged GTM for this volume vs independent operators who don't have the scale/national footprint to service large fleets all over the country (think Hertz, Enterprise, Sherwin-Williams fleets).
6) Lastly, the average Take 5 store is significantly younger than the average Valvoline store which directly impacts cars per day. Take 5 currently sees ~40 cars/day while the average Valvoline sees north of 50 (and mgmt has called out an opportunity to get to 60 CPD). Closing this gap through immature Take 5s ramping can add another 150bps tailwind.
On a very conservative basis we can underwrite a 1-3% growth in transactions and 3-4% growth in ticket leading to 4-7% comp growth algorithm.
Thesis 1B: White space under appreciated
We conducted a state by state analysis of Take 5 location count and vehicle count by state to arrive at our TAM estimate. Our TAM estimate based on one Take 5 / 100k vehicles is conservative as it ignores share gain opportunity from auto repair shops and dealers in “mature markets,” assumes no benefit from the aging car parc/DIFM shift or closing of the Valvoline penetration gap (in Valvoline’s most mature markets they are at 20-30k vehicles/store).
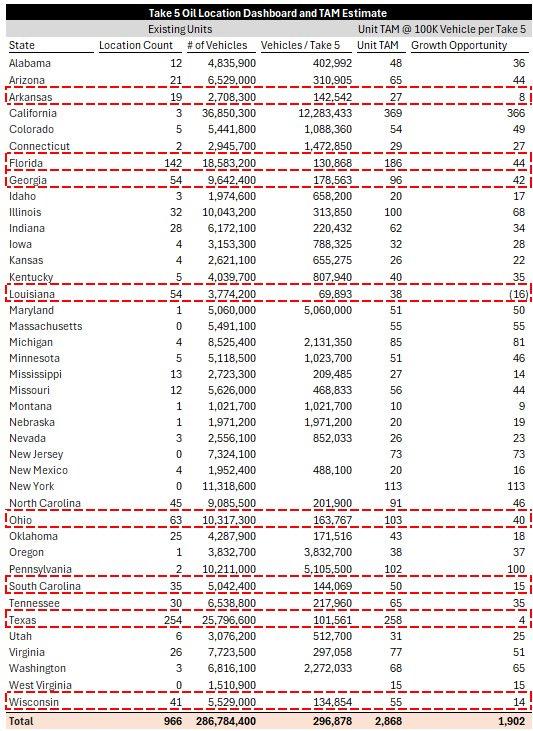
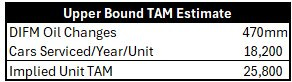
This math indicates an opportunity for an incremental 1,900 Take 5 units in the US or a total of over 2,800 stores. From a top down perspective, there are ~460mm-480mm oil changes performed per year (for a 284mm car parc) ~100mm (21%) are performed by pure play operators such as Valvoline or Take 5, while the remaining ~370mm are done by auto dealers (41%) and repair shops (38%). As shown earlier, pure play operators have better ROICs (see above) and are taking share due to scale advantages in procuring equipment/marketing/technology, shorter wait times, aging car parc and a labor cost advantage which provides a clear path for a focused pure play to capture share from independents. We believe the overall number of quick lube stores in the US is unlikely to change dramatically over the next decade, but that the underlying mix of store ownership will shift toward the majors and away from independents. We estimate from FDDs that there are over 5,000 quick lube stores owned by the “majors” (Jiffy Lube - 2,000 units, Take 5 - 1,007 units, Valvoline - 2,000 units, Express Oil Change - 330 units, Grease Monkey - 350 units, and Strickland Brothers 129 units) today and that the total unit TAM is anywhere from 9,000-25,000 units.
These 1C: High Conviction in Growth
We have conviction that Take 5 will achieve $464m in EBITDA in 2026 (up from $285m today) driven by $65m from ramping units, $43m from new corporate stores, $16m from new franchise stores and $55 from the installed base. Methodology and math below
Ramping units EBITDA Contribution
We estimate embedded EBITDA growth from ramping stores by taking our estimate of mature EBITDA contribution from both company owned and franchised stores built ‘21-’23 and subtracting their current, immature, EBITDA contribution

New Corporate Stores units EBITDA Contribution
We estimate incremental EBITDA from new corporate owned stores by modeling the new store ramp to maturity over 3 years and estimating 60, 58 and 57 stores built 2024-2026 respectively

New Franchise units EBITDA Contribution
We estimate incremental EBITDA from new franchise store builds (100/year through 2026) and ramping our unit economics and royalty rate (1%, 5%, 7% in years 1-3 respectively) through the forecast period

Mature Installed Base EBITDA Contribution
We estimate incremental EBITDA from the installed base by growing Franchise store sales at 4% and company owned store EBITDA at 5%

The key insight here is that $120m of Take 5 expected EBITDA growth is already embedded in the platform in the form of the installed base and ramping units. The franchise growth curve and step up in take rate will produce accelerating growth in high margin royalties as well which deserves a higher multiple and could catalyze a re-rating.
Thesis 2: AGN Drives Reacceleration
Auto Glass Now is the second largest company in the U.S. automotive glass repair and replace (AGRR) industry and is Driven Brands’ newest growth platform. Management loves to tout that this industry is large with scale benefits to win insurance relationships. It is generally positive for the story because it has the potential to be a large source of EV-neutral EBITDA. Safelite Auto Glass is the definitive market leader in the U.S. with approximately $2.5 billion in annual sales, or approximately fifty percent market share. Other than Safelite and AGN, there are only two companies that hold more than 1% market share. The AGN opportunity is two fold 1) ticket growth from growing ADAS penetration which requires calibration and 2) growth in insurance customers. 90%+ of new cars have advanced driver assistance systems (ADAS) that helps with safety features such as self-braking, cruise control, and lane assist. When the windshield cracks or needs to be replaced, these sensors need to be calibrated as well. This can often double the cost of repair. As CEO John Fitzpatrick has pointed out, “If you deconstruct an average check for Glass calibration as a line item is typically about $300. If you look at our average labor rate of about $20, you can sort of do the margin profile.” The incremental margin profile is 90%+ if recalibration takes an hour (the initial capex for calibration equipment is $20,000 according to management) . Since 90% of new cars have ADAS we can estimate that the % of the car parc with ADAS (using a 284m car parc) is increasing at 4% per year. As Emeth Value pointed out in their H2 23 letter, “Today, an estimated 20% of the U.S. car parc has an ADAS system with a front facing camera, which is expected to reach more than 50% by 2030, and only 10% of Auto Glass Now windshield repairs have calibration attached.”

As the car parc rolls over, calibration attachment rate will continue increasing driving 2-5% SSS on ticket alone. However, the higher ticket also drives more repairs from consumer pay to insurer pay. This dynamic favors scaled operators that have the national coverage and the tech capability to meet the demands of national insurers. Therefore, we believe large players who can reinvest in calibration and establish insurance relationships will continue to take share from independents driving double digit volume growth to mature stores. Today, insurance accounts for approximately 33% of glass sales, while the collision segment receives about 95% of its revenue from insurance. Driven can leverage its longstanding insurance relationships to establish itself as a major third-party administrator (TPA) in the insurance space. Furthermore, with all stores unified under the same brand, maintaining consistent operational standards, and utilizing a shared call center, AGN, with its nationwide locations, will also be a superior choice for insurers.
Management disclosed on the Q2’24 call that insurance/commercial fleet/out-of-pocket had an average ticket of $650/$400/$300 and calibration attach rate of 42%/31%/undisclosed. If mix shifts toward insurance and calibration attach rate continues to climb, we predict AGN AUV’s could increase 20%+.
Through our conversation with management and PCG segment leader we understand that AGN unit economics today are fantastic. With a 3 years sales ramp from ~$550k to ~$1m AUV and EBITDA margins in the range of 25-30% on an initial investment of $150-$200k implies a 100%+ pre-tax ROIC at maturity. Unit economics will continue to improve if they execute on the insurance and ADAS opportunities as well. At the investor day management disclosed that they are aiming to open 125 company owned stores and that 100 stores are still less than 3 years old. We believe the PC&G segment that houses AGN can grow segment EBITDA $65m from 2023 to 2026 to $206m with ~50% of the incremental EBITDA driven by AGN ramping and new units alone.
Thesis 3: Car Wash Segment Sale Catalyzes Rerating
From 2021-2023, Driven acquired 164 US locations and rapidly built 60 new units, spending approximately $2.1B on the car wash business, this was an exceptionally poor investment due to oncoming competitive intensity. Our proposed sale of car wash at 8.0x 2024E EBITDA would result in a valuation of $920m ($1.2B in value destruction (!) but provides a nice tax shield for remaining GoodCo), reduces leverage by 1.5 turns and catalyzes a re-rating. Despite industry issues, an active market for cash wash assets still exists as KKR bought 230-unit Quick Quack Car Wash in June 2024. There are many potential buyers for the business including large strategics (Raceway and Mister) and sponsors (KKR, Warburg Pincus, Oaktree, New Mountain, Golden Gate).
In the event of no large bulk sale of the assets, we believe the business has stabilized at $360m in sales and $110-120m in EBITDA and can be sold off in bits and pieces over time.
In the event of a transaction RemainCo would be a pure play bet on a defensive, stable cash flow stream (franchise brands) reinvesting in a crown jewel asset leading in the growing quick lube market with an embedded option on a high growth glass business. All trading at less than 9.0x EBITDA.
Risks
EV Risk (Oil change terminal value concerns)
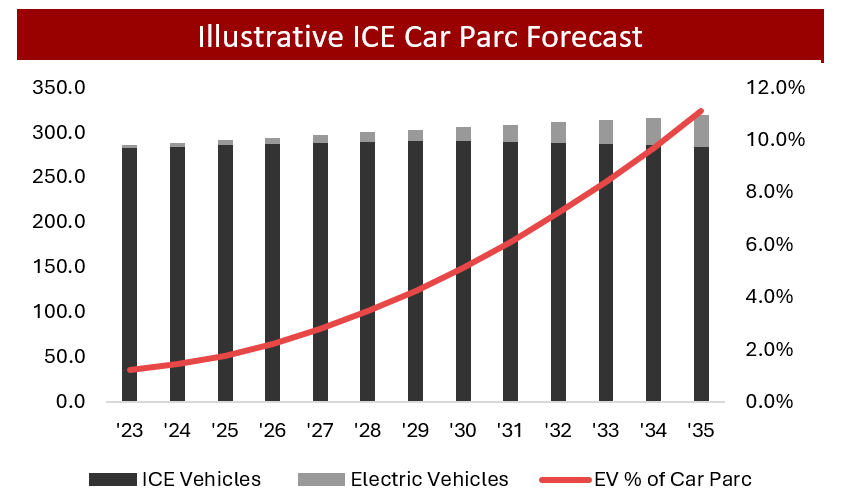
Mitigant: The range of outcomes for EV adoption are quite wide, we use the EIA‘s 12% penetration by 2050 projection as a lower bound and Toyota’s 30% as an upper bound. Using Toyota’s overly punitive scenario implies the total ICE car parc will continue to grow until 2036 when there will be 281mm ICE vehicles on the road, and EVs will still only be 12.5% of total vehicles . This indicates oil change TAM will be flat over a twelve-year period and that the US can support 9,000-20,000 quick lubes leaving the unit growth story intact
Take 5 has very low footprint overlap with high EV adoption states as only 14 company owned stores and less than 4% of franchisee stores are in the top 8 states with the highest EV penetration. Store geography distribution skews heavily to the Southeast and Rust Belt which are culturally later adopters for electric vehicles. EV adoption still faces hurdles in price, range anxiety and infrastructure (EV TCO is 19% > ICE over first 5 years of ownership)
Competitive Landscape (Why can't what happened to car wash happen to oil change?)
There have been some comments from MNRO recently on their increased focus on oil change in which their CEO has claimed that quick lubes were a “COVID beneficiary,” that they plan to win customers back from. Paired with VVV’s recent commentary on their Q4’24 call about increasing competitive intensity outside the QL channel from other DIFM competitors (58% of new customers) and it is easy to understand why questions have started to arise around the defensibility of quick lube economics and why they may face similar pressures to car wash. There are a few key differences here that we believe mitigate this risk. 1) terminal value concerns have largely kept greenfield expansion at bay (total quick lube unit CAGR over the last 5 years is 1.8% compared to 4.0% for car wash). Simply, total supply isn’t coming online as rapidly as it was for car wash so the economics aren't eroding. I think many PE shops are playing with the calculus of “why spend all this capital to get to scale for it to potentially have no terminal or have to mount a major pivot due to a changing mix in car parc?” 2) PE shops are entering the space as franchisees, not independent operators. This is probably due to two reasons: A) there aren't many scaled platforms to buy (see below) and B) The economics of a subscale independent are dramatically worse compared to scaled platforms who have procurement/tech/marketing advantages, can access fleet volumes and SLB their real estate. 3) We also believe that unlike car wash, quick lube has a long term share donor in the form of dealerships and general repair shops as well as Jiffy Lube which reduces competitive discounting among the majors who aren't yet competing head to head. Quick lubes tend to be faster, cheaper (avg ticket <$100 vs $200-300 for gen repair or dealership who use a discounted oil change as a “loss leader” to get customers in and sell them on other maintenance items) and more convenient (no appointment) than general repair and dealerships. We believe that the best customer value proposition tends to win out and firmly believe that quick lube is a better offering.

Financial Leverage
DRVN is highly levered with current net debt/ LTM EBITDA at 4.7x. $2.1 billion of this debt or 77% of total is fixed rate
Mitigant: Through growth and a shift in capital allocation away from M&A to debt paydown DRVN will delever to 3.0 Net debt/EBITDA by 2026
Management (CFO turnover and terrible capital allocation)
This is the biggest risk to the long term thesis and the reason we think you are getting paid to own DRVN today. In May 2023 Driven Brands CFO Tiffany Mason resigned after having been with the company for 3 years and was immediately replaced by Gary Ferrera. Less than a year later, Ferrera resigned and was announced as the CFO of MoneyGram International. Through our conversation with executives at competitors we believe that Ferrera left to move back home to Colorado and to re-join a familiar industry (FinTech). Current CFO Mike Diamond joined DRVN in August 2024, he was previously CFO of Michael’s and led their $5bn buyout by Apollo one year after his arrival, and CFO of Pizza Hut US and Europe where he led turnarounds in both geographies.
PE Overhang
Driven is majority owned by Roark Capital (Atlanta-based consumer PE shop) who currently owns ~62% of shares outstanding
Roark did not sell at the $22 IPO price and has consistently sold shares in the $28-$32 range, nearly 100% higher than where DRVN is trading today which provides an umbrella mitigating PE overhang risk
Driven is a meaningful investment for Roark in their two largest funds at nearly 5% of AUM and their most visible investment to the public meaning that DRVN performance has an outsized reputational impact
Therefore, DRVN working is incredibly important to Roark, aligning their interests with minority holders
Valuation
Management guided to $835M EBITDA in FY26 (revised down from $850m at the investor day due to car wash sales) on $3.4B of sales (24.5% EBITDA margin) and in our base case we believe DRVN can grow EBITDA by ~11%/year. There are 13 sell side analysts covering DRVN with consensus EBITDA of $706m. We think this is clearly too low and are projecting $762m (7.9% ahead of consensus) in our base case. The Street is underwriting EBITDA growth of 11.1% and 15.1% in FY25 and FY26 respectively and EBITDA margin expansion of 200bps from 23.2% in 2023 to 25.2% in 2026. However, our work suggests EBITDA will grow 12.9% and 22.0% because of the aforementioned Take 5 comp growth and unit expansion while AGN can reaccelerate topline due to unit growth and car parc shift to ADAS which drives calibration attachment and carries 90% incremental margin. These factors are overlooked by the Street, driving a $56m/7.9% delta to Street 2026E EBITDA. The below table excludes corporate and other EBITDA but shows where we differ from consensus.

Looking at a 6/30/2026 exit we value the Company on $762M of 2026E EBITDA at an 8.5x multiple for a total enterprise value of ~$6.475B, an equity value of $4.46B and FDSO of ~161.3mm for a target price of $27.66 and an IRR of 43.7%.

Re-rating:
Our SOTP and selected comp table suggest anywhere from 8-11x EBITDA is a reasonable multiple for DRVN due to its complexity. We would like to point out that our assumed multiple on Take 5 (10x EBITDA) is conservative when viewed in the context that the relative mix between company owned and franchised stores at Take 5 and VVV has become equal over the last 12 months and Take 5 has more immature units and therefore should have higher comp growth.

SOTP

Catalyst
Beat and Raise Cycle
Car Wash Sale
Resegmentation/Clean Accounting
We have proposed to management DRVN re-segments their financial statements to better align with how investors view the business by separating into 3 segments: Take 5, AGN, and cash generators (Maaco, Meineke, 1-800 Radiator). Management has also discusses this public at conferences
“Mike's recently joined as our CFO and one of his first observations was we should be thinking about resegmenting how we report the business to the outside world, clearly Take 5 oil changes, a crown jewel within our portfolio and probably doesn't get the full spotlight that it deserves in our current reporting structure. So I think we will be most likely reporting Take 5 oil change as a stand-alone entity or stand-alone segment starting in 2025.” - CEO, John Fitzpatrick GS Global Retailing Conference 9/4/24
“So, as part of this segmentation work that Mike is leading, it's highly likely next year that we will consolidate those franchise businesses into one segment where people can understand the stability, the predictability and the cash flow of those businesses as one segment.” - CEO, John Fitzpatrick GS Global Retailing Conference 9/4/24